How To Tell When The Stock Market Is Overvalued
one of the most asked questions that
investors are curious about
is how do you tell whether the stock
market is overvalued
are prices too high should we wait for
the market to go down
or is now actually a fine time to get in
and this is an important question to ask
because let's be honest
no one likes putting their money in the
stock market and then seeing
prices fall it's not a fun experience
i've certainly gone through it before
and it wasn't fun but there are a number
of indicators
that we can look at in order to
determine if the market is overvalued
or at the very least get a good feel for
where
market valuation stand in this video
we're going to explain
the four key indicators that we can use
to determine
whether a market is overvalued fair
valued
or under priced i'm going to use the
current usa market as an example
but you can use any market at any time
with
these four indicators
now i'm sure you've heard of this metric
before the p e ratio
or the price to earnings ratio i don't
know if you're aware of this
but you can actually get the p e ratio
of the entire market as a whole
and you can use this to get a feel for
if things are overvalued
let me explain so the market pe ratio
what you first need
is a gauge of the entire market now in
the usa
they have an index called the smp-500
the s p 500 measures the performance of
500 very large
and popular companies in the states
essentially
this index attracts the entire usa
market
it's known as a benchmark for the market
as a whole
so what we do is get the price of the
index
aka how much do stocks overall cost and
then you compare this to the
earnings aka how much money are the
stocks bringing in
in terms of profit of course so cost
versus profit
it's the oldest benchmark figure in the
book and this pe
is simple to find all we do is do a good
old google
search and we go on the website multiple
dot com
which shows us this graph now as you can
see the current
s p 500 p e ratio is 32.95
if you take that and look through
history you can see that it's quite a
bit higher than its normal figure
the average pe ratio throughout history
is 15.85
right now it's double that which isn't a
good sign
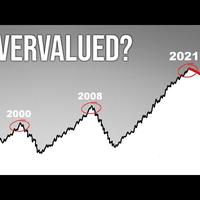
i mean the p e ratio is similar to what
it was back in 1999
where the dot-com crash was just about
to happen
in 1999 the market pe was 32.9
similar today this potentially means the
current market
may be overvalued but we have to look at
the other indicators
in order to confirm this hypothesis
now there's been investors who've come
along and have criticized the
traditional p e ratio
for measuring the market they say
earnings in a particular year can
fluctuate
because of business cycles and thus it's
not accurate
that's where professor robert schiller
came along and he developed something
called the schiller
p e ratio what he did was he averaged
the earnings over the past
10 years and he adjusted them for
inflation
so that market fluctuations would not be
in the equation
thus a lot of investors believe it's a
more accurate way of measuring the
market
anyway so currently the shell of pe
ratio sits at 30.27
that's a lot higher than what it
normally is if you look back through
history
the average schiller p e ratio
throughout history the past hundred
years or so
is 16.75 so it's about 14 points higher
than the average at the current point in
time
of making this video however the average
over the past 20 years
is 25.6 which would make things
seem a whole lot more reasonable and by
the way yes i'll leave a link in the
description if you want to check out
these graphs that i've shown you
but there's more to the story than what
i've shown you there's more indicators
we need to look at
to confidently tell whether the market
is overvalued
or not
warren buffett okay he's known as the
greatest investor of all time
he's also known as someone who doesn't
like to time the market
he just focuses on buying good quality
companies on sale
however he does use one formula to see
how the market is looking
he said in a fortune magazine interview
that it is probably the best single
measure
of where valuation stand at any given
moment
what the buffett measure is is it's the
market cap of
corporate equities divided by nation's
gdp
essentially it's the total prices of
stocks compared to how much they're
producing
in terms of goods a gross domestic
product
so at the current point in time the
buffer indicator sits at 171.7
now that's high it's higher than what it
was in the 2008 housing bubble crash
and it's even higher than what it was in
the dot-com
market crash i mean as buffett said the
indicator spiking before the dotcom
crash
should have been a very strong warning
signal and perhaps
it should be the same thing today
because what it's saying
is corporate equities you look at the
prices and they're very high
then what you do is you compare it to
how much these equities are producing
gdp aka how's the economy going
and it's not going great so there's a
big distinction between prices or stocks
and the economy and this is why you see
such a high figure
with the buffett indicator now this for
me is the ultimate way of determining
whether the market is overvalued or not
because what you're doing is relating
the returns that you can get in the
market
versus the returns that you can get in
other asset classes at the end of the
day
when something is overvalued it's all
relative and you need to be comparing
this to something
and this is what this method does let me
explain
the very first thing that we need to
determine is what the return that we can
get
in the market currently and a lot of
beginner investors mostly will say
you can't find that out well you
actually can
with a simple calculation so do you
remember we calculated the market pe
earlier on we're going to need that
figure again
so the market pe how good your memory
it's 32.95
price divided by earnings equals 32.95
for this calculation we need the inverse
of that
okay earnings divided by the price
so if we divide one by 32.95
we can see that earnings is 3.03 percent
of the price so if you pay a hundred
dollars for stock
in the market you'll get three dollars
and three cents back
on average aka a 3.03
return so the market return is 3.03
however the one thing that we're missing
is the growth
in the equation the growth of these
earnings because earnings will grow as
time goes along
everyone knows that to calculate growth
that's very simple as well
we just see what growth has been over
the past couple of years
and we extrapolate that to the future so
what we do is we type in
usa gdp growth on google and we can see
that it grows
somewhere in between two to three
percent
at least that's what it's done over the
past five or so
years so we can assume that in the
future
it will be doing something similar so
what we need to do is add 2.5 percent of
growth to our original
3.03 percent figure and we get a 5.53
percent return
meaning if we buy stocks in the usa
market
we can expect a 5.53 percent average
long-term return normally the market
will give you a ten percent return on
average
at least that's been the average
annualized return since the twenties
nineteen twenties
however because stocks are at very high
prices
that return has gone dramatically lower
as i'm sure you know
the higher amount you pay for something
the lower the expected return is
that's just basic accounting basic
business
so the stock market return in the usa is
5.5 percent
around that anyway however what about
other asset classes because as i said
it's all relative
we have to have our money somewhere
right in some form of asset and cash or
whatever it may be now the main asset
that investors compare things to
is bonds these are the two main forms of
passive income assets
that investors focus on bonds and stocks
of course you got real estate as well
but that's less passive
and not everyone wants to do that so
it's normally
bonds slash money in the bank versus the
stock market
luckily the return for bonds is a lot
easier to get
all we need to do is go on the cnbc
website
straight to the 10 year treasury bond
as you can see right now it's sitting at
0.86 percent
very very low doesn't matter what you
compare it to
if we look back through history it's
basically at the bottom
and if you look at the two-year treasury
it's a lot worse
it's at 0.16 percent essentially
that's just nothing so if you have your
money in bonds
you're getting a very low return and
it's the same with a bank
banks at the most you're going to get a
one percent return each year
and the reason for this is because of
the fed of course
they control interest rates and they've
set interest rates to essentially
as low as it can possibly go before it
reaches
negative so if we look at this from an
investor's point of view
you analyze all of the indicators and
what they point to
is the market being overvalued you do
the calculation and you can
realistically only expect
a 5.5 percent return at current prices
compared to the 10 return in which you
normally would get
then you go and look at the other main
option where you can put your money
and that's the bank and bonds and if you
put your money there
you'll actually lose money because
inflation is normally two percent
which is greater than the one percent
ish return in banks and bonds
and this is why you've got investors
still investing in the stock markets
even though prices and indicators are
showing us
that it is very high there's nothing
else to do with your money
bonds give you nothing the bank gives
you nothing
so the main factor that will change
things is if the interest rates
go up and that's the one factor that we
really
need to keep our eye on anyway what i've
just showed you is tried and true
methods
used by investors throughout time in
order to get a gauge
of the market and i thought it useful to
share with you guys today
invest wisely everyone
you