Analyzing Server Logs with Kibana
so now that we've actually got file beat
up and running in imported some access
logs into elasticsearch let's use Cabana
to visualize that data using the
dashboards that come with file beat
makes life a lot easier and it's pretty
fun too so let me show you how to get
started so while your server is still
running go ahead and pull up Cabana to
do that just go to 1:27 dot 0 dot 0 dot
1 colon 5601 and you should get to a
screen that looks maybe something like
this click on the management tab and the
first thing we need to do is create an
index pattern for our new file beat
index that we import it so click on
index patterns and right now you should
just have that Shakespeare pattern that
we used earlier in the course but let's
add one for the actual access logs that
we just imported so say create index
pattern and type in file beat dash star
and hit enter and sure enough it found a
file beat index that we can play with
and here are some of the fields that we
have to work with here it's good to
familiarize yourself with them for so
for example if you wanted to look at
response codes that would be under
Apache to not access dot response
underscore code so this is the structure
that file beat has imparted upon our log
data while importing it directly into
elasticsearch alright so we have that we
can make that our default if you'd like
and let's mess around with it let's go
to the discover tab and see what's in
there kind of explore some of the data
and you can see we're still in the
Shakespeare index we have to switch that
just click on Shakespeare and change
that to file beat now it's going to say
no results found and this can be very
confusing so don't let this discourage
you there really is data there the trick
is that you need to get the right time
range okay so up here in the corner you
see where it says last 15 minutes that
means that you're only looking at data
that came in during the last 15 minutes
and since we're using an older log file
that was generated in May of 2017
in order to see anything in cabaña first
we need to change the time field the
time range to actually encompass the
data that we have to work with so click
on that and now we can change that to
absolute and change this to the first
week of May so we'll go from May 1st
2017 to May 6 27 teen and hit go and now
after that does a little bit of
searching it should come back with some
actual results all right that's more
like it so this is more interesting so
we're seeing already here just a count
of how many documents came in how many
individual access hits or log lines
occurred over time during the state
range so you can see there was a big
peak of activity on May 5th around
midnight mmm I wonder if that was a
spider or a bot of some sort I bet it
was and you can kind of preview some of
the data here as well so if you want to
explore any individual time entry here
you can open that up and see what's in
there ok so from here you can do
searches so for example if you did want
to search for a 500 you know server
errors for example you could copy and
paste this Apache to access dot response
code here for example and the syntax up
here is just field name colon whatever
you want so that will give you back all
the 500 errors and you can see that they
occurred in the Big O little spike on
May 5th
well let's pour that more deeply in a
moment you can also just click on these
things too and say add and automatically
take a look at it that way too
and explore it in more depth so if you
want to look at individual 500s that
would be a good way of doing it you can
see that this one's coming from Beijing
China and this is why we installed that
geoip plugin for elastic search by the
way it allows you to see very easily
where these IP addresses are coming from
which can be useful for tracing down
where issues like this or originating
from this one came from Mountain View
North America so probably just Googlebot
or something take a look at another one
here Kiev interesting all right but you
know looking at textual results is all
well and good but I want pretty charts
and graphs you know that's what we came
here for I want something that can give
Google Analytics a run for its money
only it's for free and I run it all
myself the great news is we imported a
bunch of dashboards as part of
installing file beat previously so let's
use them just click on the dashboard tab
here and look at all these goodies that
we have if we go back to the dashboard
main dashboard page here you can see
there are many to choose from we are
using an Apache to log so we're gonna
click on file beat Apache - - dashboard
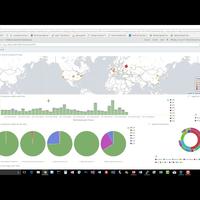
and check that out
so this looks you know pretty useful
we're seeing a nice little chart here of
all the hits per time per minute here
from the blog data that we're using in
the date range that we specified and you
can drill in on these you can see
there's stacked bar charts so they're
actually telling you broken down by
access code what's going on here and you
can see there there's that little
anomaly of 500s there that's sticking
out on top of that particular time slot
on the midnight hour of May fifth and
out here you can see things like how the
request codes break down you can see we
had a little bit of a flurry of 301's
at one point this is how the access urls
break down you can look at the actual
breakdown of browsers that are hitting
your data that's kind of cool too broken
down you know by Chrome and individual
versions of Chrome on this outer ring
for example that's how to read this one
so this inner ring is the browser type
and then we have individual versions of
that browser broken down outside of that
ring as well you can also take a look at
what operating systems are hitting your
website with this little graph here you
can see that other is pretty popular and
that's because BOTS select my site as
much as humans do but you know all sorts
of cool stuff and if we had configured
things to import error Lots as well we'd
see even more stuff you know since we're
only dealing with an access log in this
particular example we're only seeing
half of what this has to offer but you
can see it's pretty cool stuff you can
also see that there's a hotspot here
looks like it's in Moscow so for example
you can also drill down here I mean the
best way to learn this is to just play
around with it so I encourage you to
just play around with it let's drill in
on that 500 spike there that we had you
can see if I click on this individual
piece of the stacked bar chart up here
it prompts me to apply the following
filters so do I really want to narrow
down my visualization to 500 access
codes during this particular hour yes
yes I do and now we can see that this
flurry of five hundreds came during a
very specific time range between 7:15
and 8:15 of may 5th 2017 and furthermore
it came from these places so you know if
we actually click on that we can
actually expand any of these by the way
to get a closer look so let's go ahead
and open up that map and we can drill in
and see that that's actually coming from
Moscow I'm not making this up folks
someone from Moscow was hitting my site
hard this at this time and actually
crashed my server for a while so
conspiracy probably not it's probably
just some spider some innocuous search
engine because because frankly this
website isn't scaled very robustly so
probably not evil it's probably my fault
for not having enough capacity but
anyway there you have it I'll begin
closed back out of this shrink it back
down and remove these filters by just
hitting the trashcan here and we're back
to where we started and you can put the
date range back to whatever you want as
well so fiddle around and in our next
lecture I'll give you a little bit of a
challenge to try and find a specific
answer to a specific problem so let's
try that next